
Staying up to date with ecommerce and online shopping trends is essential for any online business in 2019. With so many shoppers scouring the internet for the best deals to save them time and money, you need to make sure your website offers the best user experience possible.
So, what trends are the most crucial for your business? Mobile continues to be an increasingly important factor, and omnichannel shopping is becoming more prevalent as well. Other areas of note are video and image search, voice search and influencer marketing, which is said to be one of the fastest-growing customer acquisition methods on the internet.
It might sound a bit overwhelming, but that’s because baby boomers, millennials and Gen Zers alike all engage with online shopping differently. To be sure you’re not missing out on any lucrative opportunities, staying up to date with the latest ecommerce dialogue is a must.
We’ve identified 77 of the most important ecommerce and online shopping statistics you need to know to be successful. They are listed under the ten major categories below:
- Conversion Rate Optimization Stats
- Mobile Commerce Stats
- Shopping Cart Abandonment Stats
- Email and Retargeting Campaign Stats
- Video Content Stats
- Social Media Stats
- Voice Search Stats
- Local Search and Omnichannel Stats
- Customer Relationship Management Stats
- Influencer Marketing Stats
1. Conversion Rate Optimization (CRO) Stats
Searchers are more savvy than ever, and can spot a site that isn’t up to date with its design and user experience. To give the user the best experience possible, webmasters and digital teams are constantly testing and tweaking their sites to ensure all pages are optimized.
- 60% of digital marketers plan on implementing customer journey analysis to improve conversion rates this year (source)
- Videos and landing pages can improve CRO by as much as 86% (source)
- Page-load speed delayed by even 1 second can reduce conversions by 7% (source)
- Companies with 40+ landing pages generate 12x more leads than those with only one to five landing pages (source)
- Building and testing landing pages is one of the top five problems for digital marketers (source)
- 48% of marketers build new landing pages for each campaign (source)
Only 52% of companies that use landing pages test them to improve conversions (source)

Key Takeaways
A fundamental understanding of how your customers navigate your funnel is essential to increasing conversions. To implement such analysis effectively, you need to learn how your customers interact with your website, and determine what you can do to make their experience more seamless and enjoyable.
Try running heatmap testing to see where users are spending most of their time on your pages. You can also run A/B tests to see if certain copy or design changes drive more conversions than others.
2. Mobile Commerce Stats
Mobile users are on the rise. As Google continues to unfurl and improve Mobile First indexing, online companies should always keep in mind their mobile experience when creating new web pages. Pages should look identical and flow seamlessly on mobile devices.
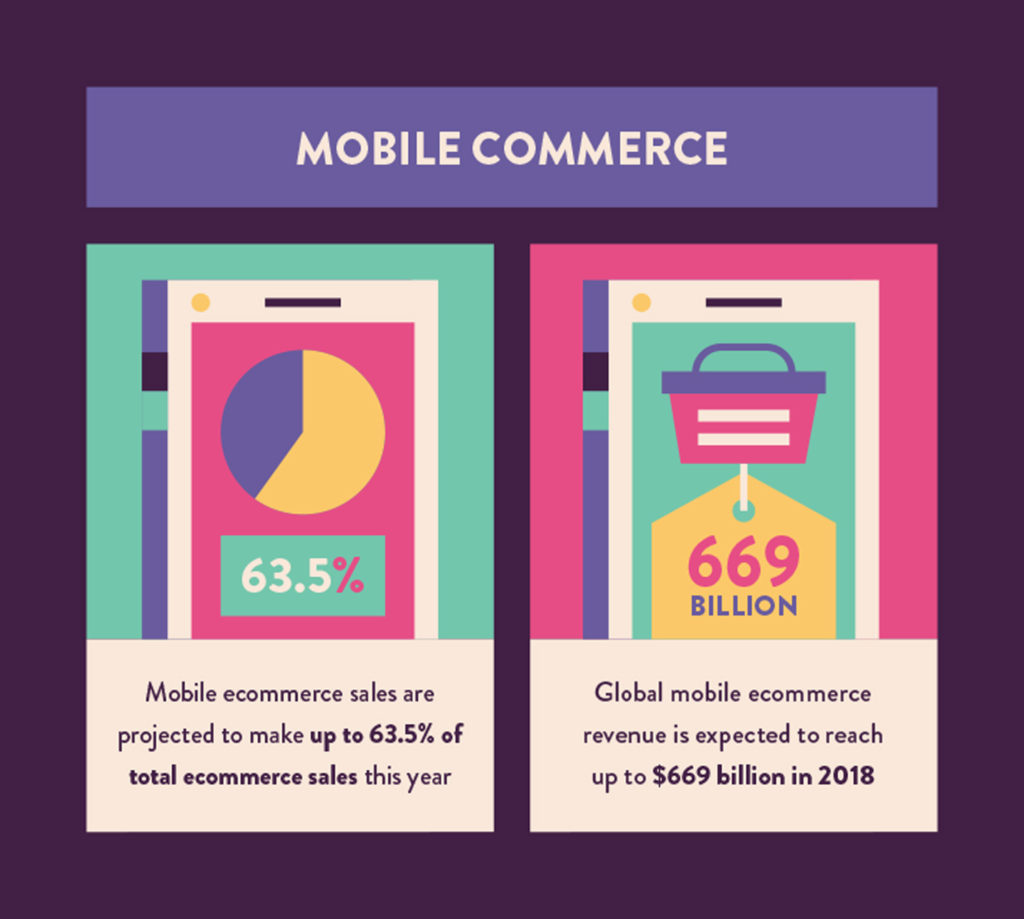
- Mobile ecommerce sales are projected to make up to 63.5% of total ecommerce sales this year (source)
- Global mobile ecommerce revenue is expected to reach up to $669 billion this year (source)
- Mobile sales on Cyber Monday in 2017 broke $2 billion, making it the largest online shopping day in history (source)
- Eight in 10 Americans shop online; 51% of them have purchased something with their smartphone (source)
- By 2020, more than 3.3 billion users will have virtual assistance on their devices (source)
- Mobile wallets are expected to surpass both credit and debit purchases by 2020 (source)
- In-store mobile payments are expected to reach $503 billion by 2020 (source)
- 40% of mobile users leave pages that take longer than three seconds to load (source)
Key Takeaways
All of your web pages should be optimized for mobile. A poor mobile experience will hurt your ranking ability and could cost you sales. Users are prone to bouncing off of sites with slow loading times and poorly designed mobile pages. There are several guidelines outlined by Google about how you should design a site for mobile users. In the end, your goal should be to make things easier for the user.
To improve your mobile experience, convert key product and sales pages to Accelerated Mobile Pages (AMP) and make sure CTAs are prominently placed so that they are easy to see and press while scrolling.
3. Shopping Cart Abandonment Stats
Shopping cart abandonment has always been an issue. As users continue to shift to online shopping, companies have tried various techniques for keeping users from leaving a full cart without purchasing.
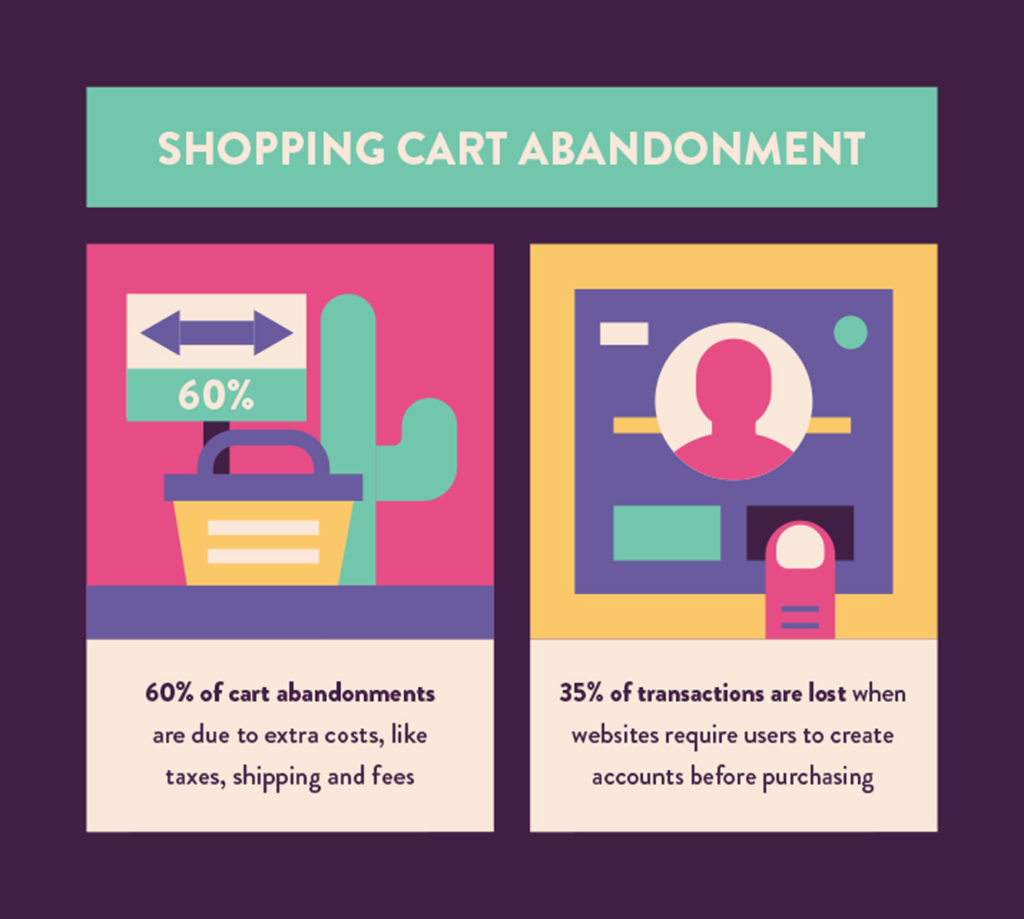
- 60% of cart abandonments are due to extra costs, like taxes, shipping and fees (source)
- 28% of US shoppers abandon their orders due to a complicated or drawn-out checkout process (source)
- The average ecommerce site can increase conversion rates by 35.26% by improving their checkout design (source)
- 58.6% of shoppers abandon carts while browsing or because they are unready to buy (source)
- 35% of transactions are lost when websites require users to create accounts before purchasing (source)
- $260 billion is recoverable through improved checkout processes (source)
Key Takeaways
Shopping cart abandonment is bound to happen. Many users add items to the cart with no intention to buy, while others may be comparing your prices to other vendors. What you should be worried about is how many of those abandonment cases are due to a poor checkout experience.
Users generally don’t like creating accounts before purchasing, and many will abandon their cart once shipping costs and taxes are factored in. To avoid losing sales, offer several types of payment options and make sure there as few steps as possible. Another tactic is an email reminder when users leave things in their cart to remind them to buy.
4. Email and Retargeting Campaign Stats
By 2019, total display and ad spending is expected to surpass search by 28 percent. Why the sudden surge? Marketers are just now realizing the potential in remarketing: Conversions increase the more a user has seen an ad.
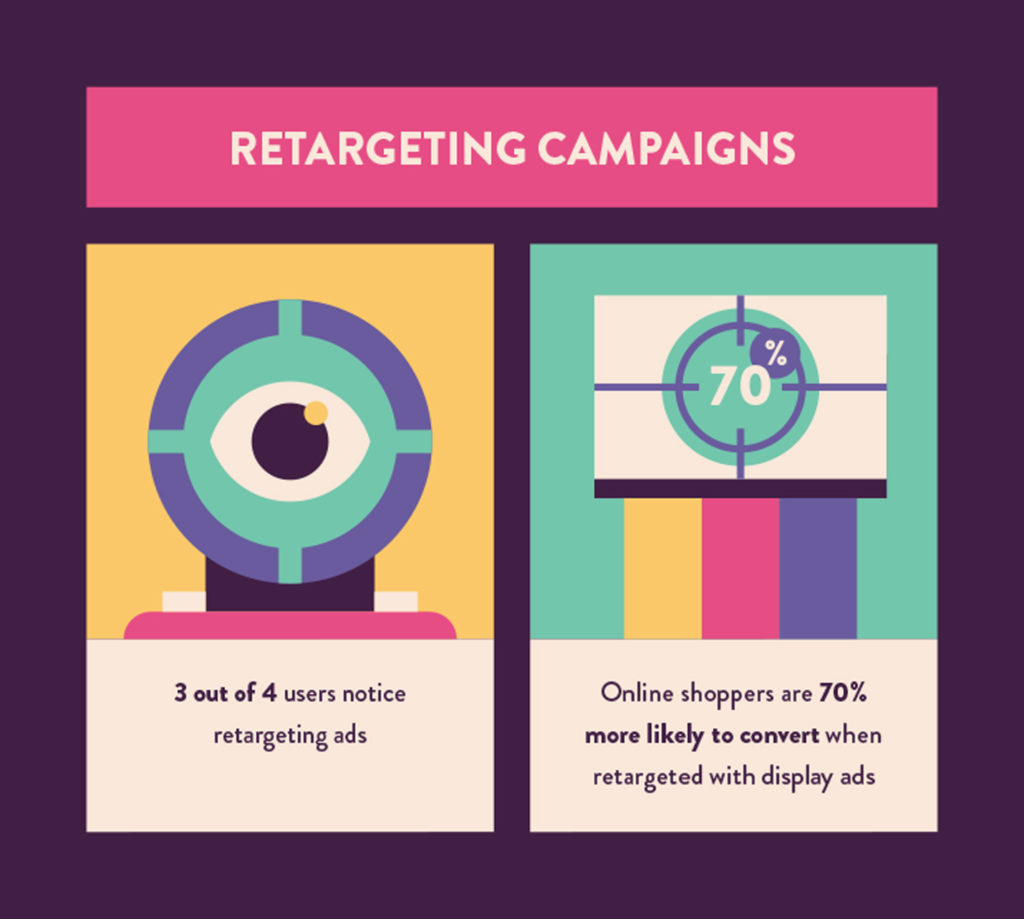
- Online shoppers are 70% more likely to convert when retargeted with display ads (source)
- 54% of shoppers say they would purchase abandoned items if those items were offered at a lower price later (source)
- 72% of customers abandon their shopping cart; only 8% of those return to complete checkout (source)
- But 26% of online shoppers will complete the checkout process after seeing a retargeted ad (source)
- Three out of four users notice retargeting ads (source)
- 24% of companies with over 1,000 employees spend 50% or more of their marketing budget on retargeting (source)
- 72% of millennial shoppers say they don’t mind retargeting (source)
- 55% of shoppers claim that testimonials and reviews influence their buying decision (source)
Key Takeaways
Retargeted display ads and email campaigns are some of the best methods to rekindling relationships with former customers. One proven tactic is to offer discounts in your retargeting emails, making sure to include the promotion in your subject line.
It’s also a best practice to retarget current customers. This keeps them in the loop about promotions and prevents them from switching to a competitor in the future.
5. Video Content Stats
Video content is eye-catching and can showcase your products in real time. Users prefer this experience, as it allows them to visualize owning the product before purchasing it. Users also like to compare products online, so having multiple angles of a product, or a demo video of how it functions, is preferred.
- 4x as many consumers prefer to view a video about a product than read about it (source)
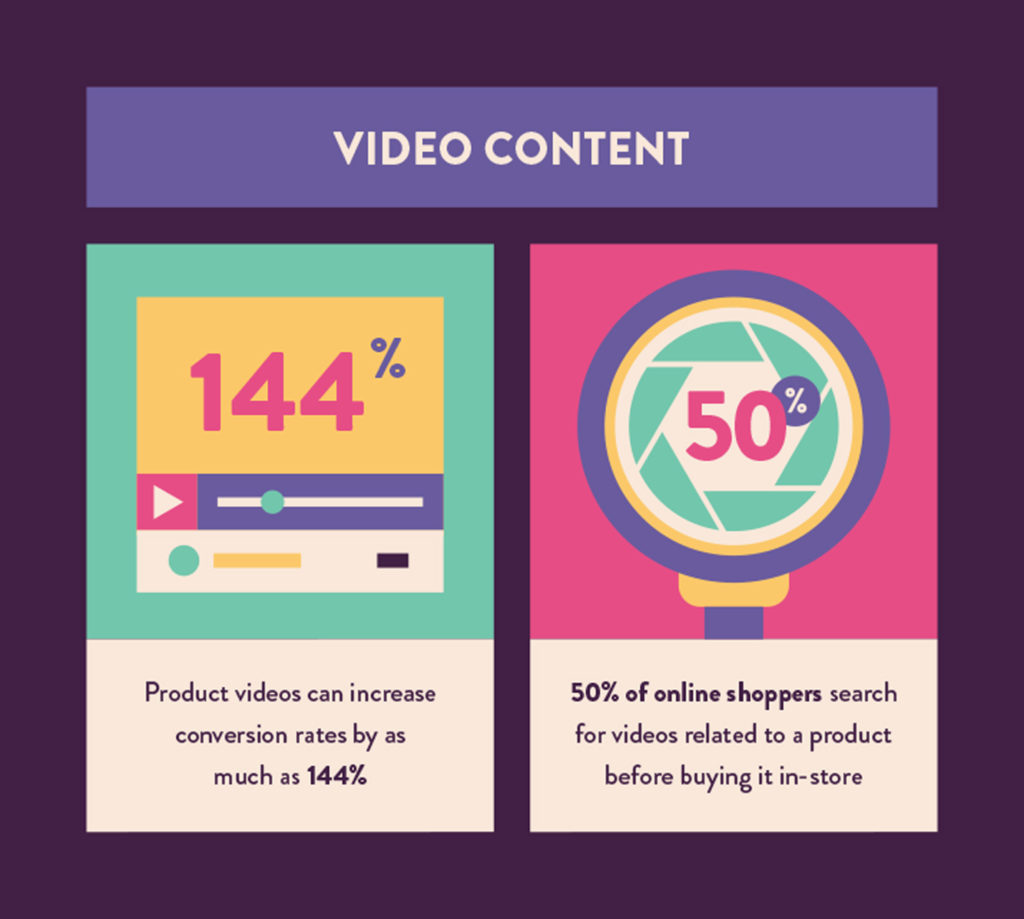
- Product videos can increase conversion rates by as much as 144% (source)
- Videos can increase organic traffic up to 157% (source)
- 43% of internet users want to see more video content (source)
- Four out of 5 consumers find demo videos helpful when making a purchase (source)
- 43% of viewers will interact with a brand on social media over video content (source)
- Roughly 50% of online shoppers search for videos related to a product before buying it in-store (source)
- 92% of shoppers say visuals influence their buying decision the most (source)
Key Takeaways
Video is a must for increasing brand awareness and conversions. Visual content tends to perform the best in terms of shares, and it also has the potential to increase referral traffic to your site when shared on social media platforms.
For the best results, invest in producing high-quality video content, post it regularly both on your website and social channels and track how your audience reacts to your content.
6. Social Media Stats
Social media is a great way to increase referral traffic and conversions for brands that have learned to use it properly. The key is to determine which social platforms work best for your industry. Brands that thrive off of visual content do well on Pinterest or Instagram, for example.
- Visual content is 40x more likely to get shared on social media than other forms of content (source)
- Facebook influenced 52% of consumers’ online and offline purchases in 2015 (source)
- 85% of all ecommerce purchases from social media come from Facebook (source)
- Facebook has a conversion rate of 1.85%, the highest out of all social media platforms (source)
- Stores with a social media presence have on average 32% more sales than stores without one (source)
- 48% of Americans have engaged with a company or brand on social media (source)
- 84% of US online shoppers review at least one social media site before making a purchase (source)
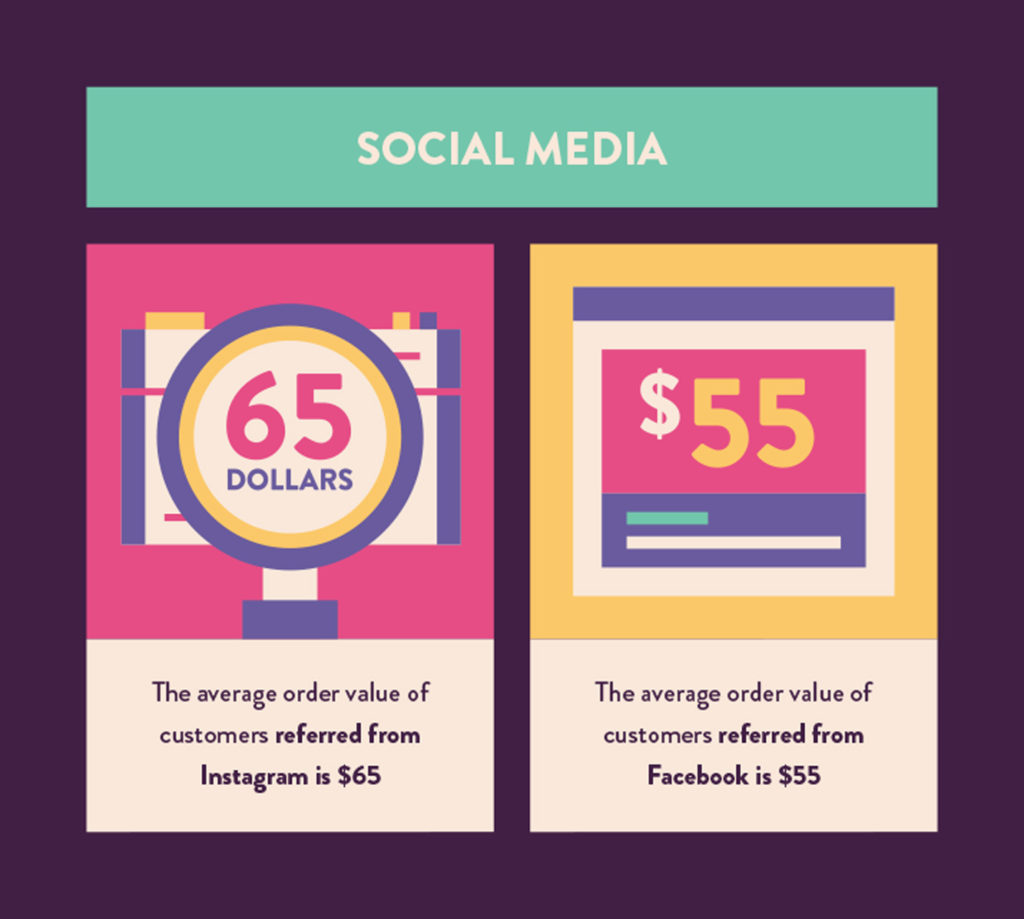
- The average order value of customers referred from Instagram is $65 (source)
- The average order value of customers referred from Facebook is $55 (source)
Key Takeaways
Social media is a great way to build brand awareness. For the best results, analyze what competitors are doing to see which channels garner the most responses from your target audience. Once you’ve figured out your areas of focus, develop a content calendar so you’re regularly updating your social media accounts.
7. Voice Search Stats
Voice search is projected to become the preferred search method in the coming years. Though far from perfect, users are growing more accustomed to voice search because of the prevalence of smart speaker devices in homes, voice search options on smartphones and machine learning, which allows smart devices to better anticipate searcher intent over time.
- Voice and image search are projected to make up 50% of all searches by 2020 (source)
- 40% of millennials have used voice search before making an online purchase (source)
- 76% of smart speaker users perform local searches on a weekly basis (source)
- Of those users, 53% search every day (source)
- 58% of consumers have performed voice searches to find local businesses information over the last year (source)
- 46% of voice searchers search for local businesses daily (source)
- 46% of consumers would like to hear a businesses prices over voice search (source)
- 27% of searchers visit a business’ website after finding it via voice search (source)

Key Takeaways
Voice search is becoming more popular as voice-first devices and voice search for smartphones become more sophisticated. Siri alone handles 1 billion voice search queries a week, and a large portion (22 percent) of those searches are local.
To optimize for voice search, you need to think of “conversational” long-tail keywords that pertain to your business and have a section of your FAQ page dedicated to answering those queries.
8. Local Search and Omnichannel Stats
Local search and omnichannel shopping go hand in hand. Many shoppers are beginning their purchasing journey online to research a product before buying it in-person at a brick-and-mortar location.
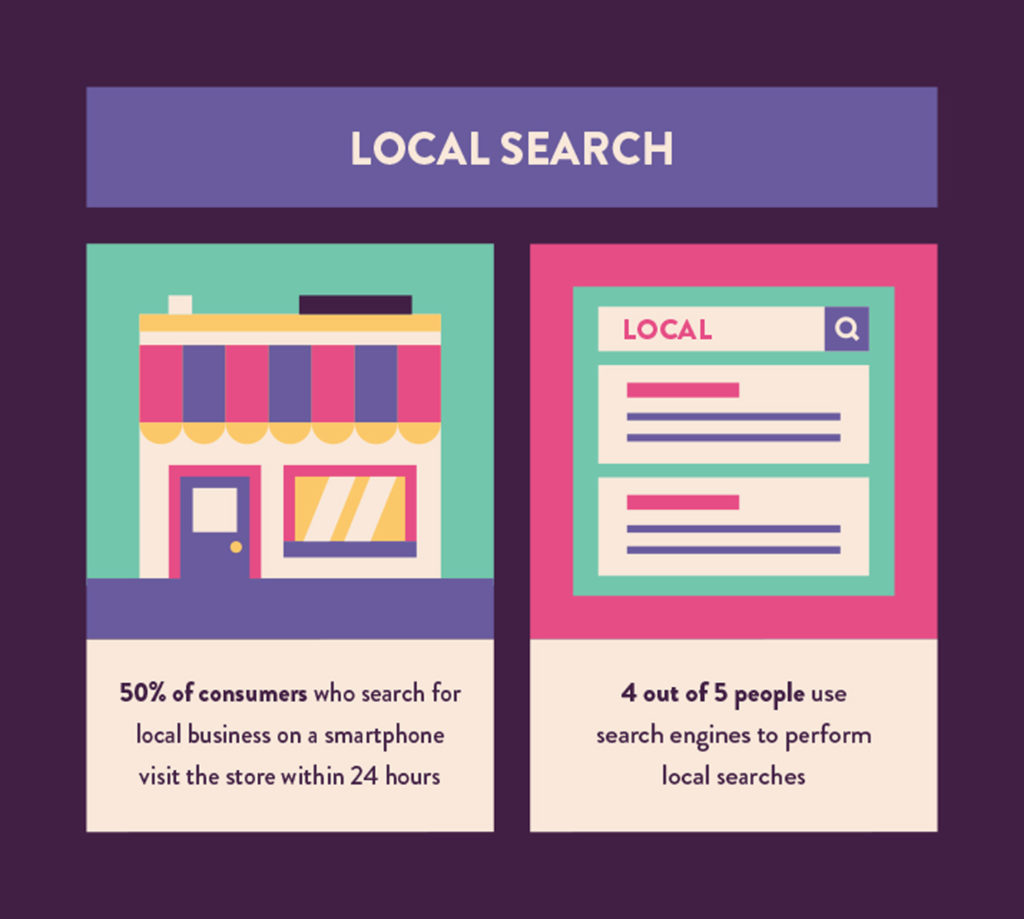
- 50% of consumers who search for local business on a smartphone visit the store within 24 hours (source)
- 18% of local searches lead to sales (source)
- Four out of 5 people use search engines to perform local searches (source)
- 73% of smartphone user participants in a Google survey said that directions were important in local PPC ads (source)
- 70% of computer and tablet users in the same Google survey said it was important that ads be customized to their immediate surroundings (source)
- 98% of Americans switch between devices multiple times a day (source)
- 77% of companies with a strong omnichannel experience store customer data across multiple channels (source)
- Companies with strong omnichannel engagement retain 89% of their customers (source)
Key Takeaways
As a local business, it’s more important than ever to have an online presence. Users often compare products online before heading in-store to purchase them. Still, other users might prefer to shop local and purchase online, while others solely prefer the in-store experience.
Whatever the case, the advantage of having both an in-store and online clientele is that your business can cater to baby boomers, millennials and Gen Zers alike.
9. Customer Relationship Management (CRM) Stats
The CRM industry is worth $36 billion. CRM software makes it easier for companies to stay up to date on customer relationships in every area of the purchasing funnel. With such a comprehensive resource at hand, it’s difficult for customers to fall between the cracks.
- 79% of leads fail to convert without CRM software (source)
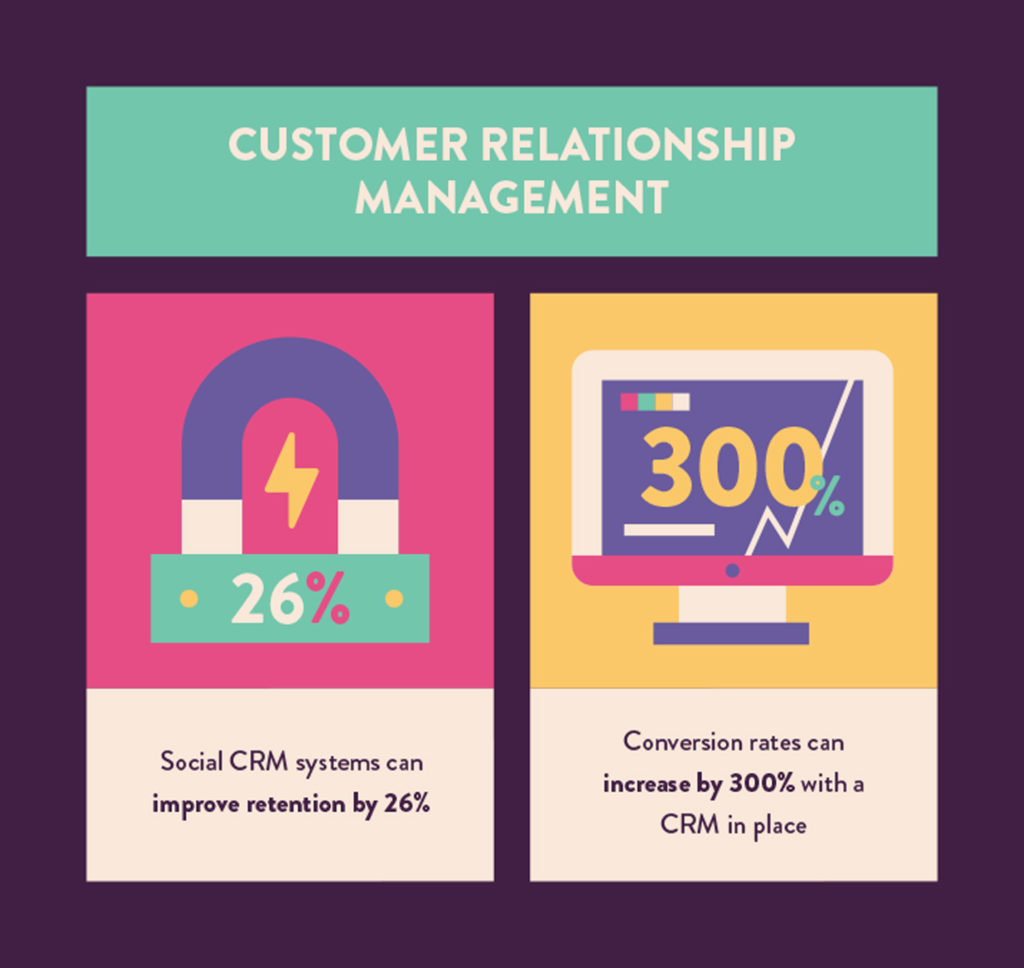
- Social CRM systems can improve retention by 26% (source)
- Conversion rates can increase by 300% with a CRM in place (source)
- 74% of businesses using a CRM report better customer relationships (source)
- The average ROI on CRMs is $5 to every $1 invested (source)
- CRM software can improve sales by as much as 29% (source)
- 22% of salespeople have no idea what a CRM is (source)
Key Takeaways
CRM software provides the best means to centralize all of your interactions with previous, current and potential customers in one place. By allowing you to monitor each step and phase of the customer journey on an individual basis, you significantly increase your chances of capturing and converting leads while improving retention.
10. Influencer Marketing Stats
With the emergence and maturation of real-time platforms like Snapchat, Instagram and Twitter over the last few years, influencer marketing has become a truly effective way to sell a product. Users have begun to place more stock in Instagram and Youtube influencers in particular, compared to celebrities, since these internet stars are more relatable.
- 39% of marketers plan on increasing their influencer marketing budget in 2018 (source)
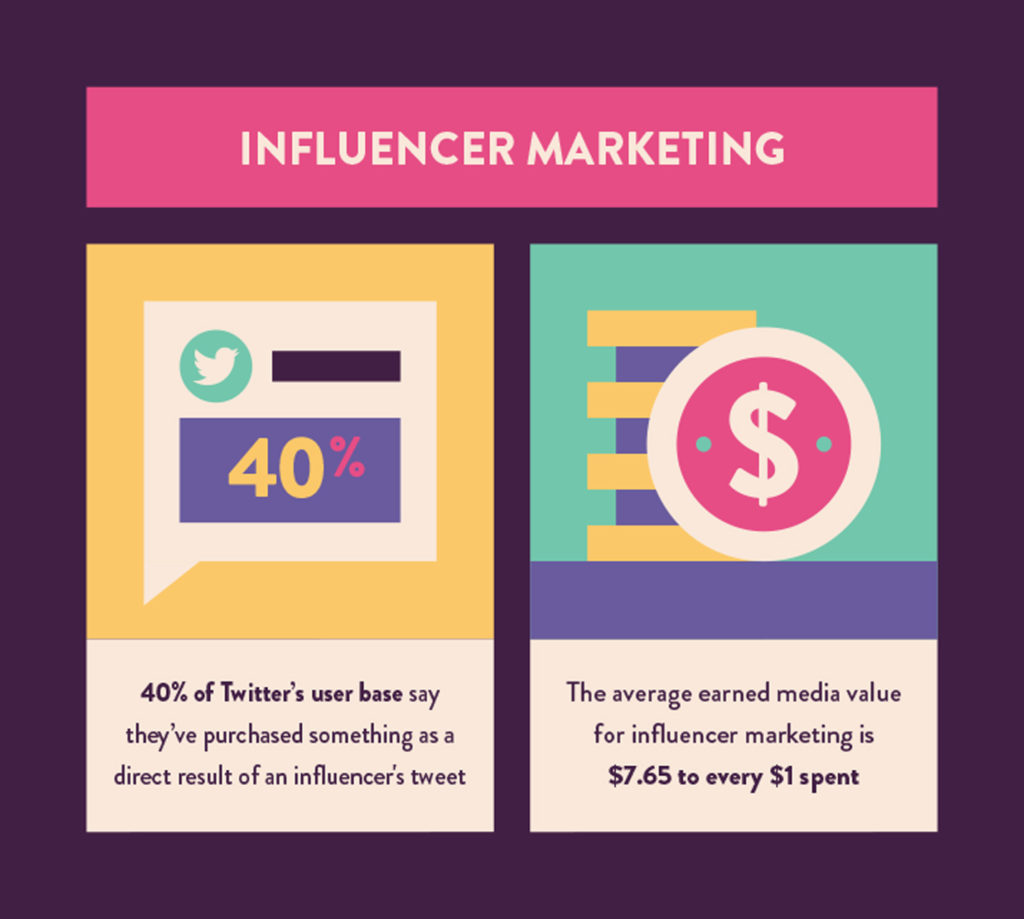
- A Twitter study reports that 40% of its user base say they’ve purchased something as a direct result of a Tweet from an influencer (source)
- 80% of influencers use Instagram to post original content (source)
- 28% of marketing managers ranked influencer marketing as the fastest-growing customer acquisition method on the web (source)
- The average earned media value for influencer marketing is $7.65 to every $1 spent (source)
- 37% of marketers in a 2017 Influencer Hub Study are allocating budgets for influencer marketing (source)
- Out of that survey, 67% of marketers plan on increasing their influencer marketing budget (source)
Key Takeaways
The main benefit of influencer marketing is that ROI is easy to trace. As seen in the stats above, many users purchase products as a direct result of a favorable review from an acclaimed influencer. These have sometimes backfired for brands, so always be careful to choose an influencer that can follow direction from your brand.
Summary
The future of shopping is online. Shoppers of all ages have higher expectations than they used to, and the only way to cater to different age groups and preferences is to ensure your site is convenient and trustworthy. Give your users the best experience possible and you’ll the reap the benefits later.

The post 77 Online Shopping Statistics for 2018 appeared first on HostingFacts.com.


