
REVIEW – Monitoring electrical usage is useful to reduce energy cost, to understand what electrical devices are being used in real time and historically, and to discover abnormal operation that may indicate current or anticipated problems with electrical devices. Sense Home Energy Monitoring has the potential to achieve all of this. Read on to see what I think!
What is it?
The Sense Home Energy Monitor is a device that is installed in an electrical panel and monitors the current and voltage supplied to that panel at a high sampling rate – about 1 million times a second (1 MHz). It provides the instantaneous Watts consumed on a timeline displayed on a mobile app. The device also analyzes the data it collects and sends the data to Sense.com. There, the data is matched to other data collected by other devices using machine learning algorithms. When Sense.com matches a device to data collected by the Sense Home Energy Monitor the Sense app will be able to alert the user when that device is on and other statistics about that device’s use. Sense integrates with IFTTT so that it may act as a trigger to other actions when devices turn on or off. The app also provides its own set of alerts, as discussed below.
What’s in the box?

Sense Home Energy Monitor
Intro Manual
Install Manual
Sense sticker
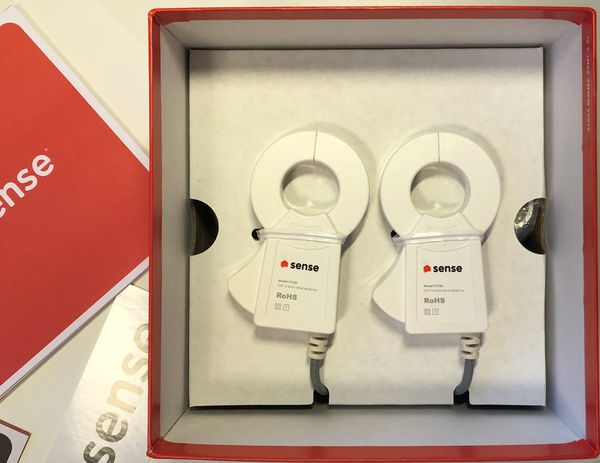
2 current transmitters
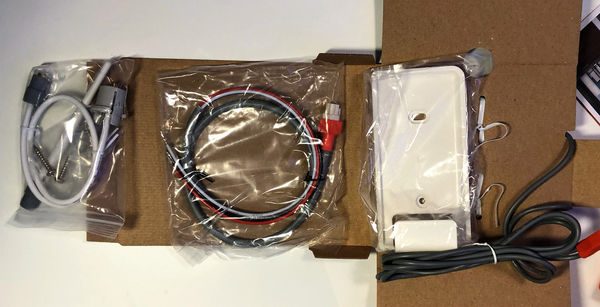
240V supply line
WI-FI antenna
antenna extension cord (for inside cabinet installation)
mounting bracket and screws (for external cabinet installation)
Design and features
Specifications
Technical Specs
Monitor Size and Weight: 137mm x 66mm x 32mm, 220g
Power consumption: < 5W, 0.1A
Current Transformer Specs
CAT III 300V 250A max
Cable length: 46″ (116.84cm)
Inside Diameter: 1″ (2.54cm)
Environmental Ratings
Relative Humidity: < 90%:
Temperature: 32-122ºF (0-50ºC)
Elevation: < 9842′ (3,000m)
Compatibility
120VAC (90V-130V), 60Hz
200A, 120V split-phase service.
Wireless
802.11b/g/n Wi-Fi
Bluetooth Smart
Bandwidth use: ~300MB per day
Signal Processing
1MHz Sampling Rate
(4M data points per second)
1GHz ARM Processor
Unboxing
The Sense Home Energy Monitor comes in a glossy cardboard telescopic box. The front of the box shows the sense inside at actual size. The sides of the box show icons of different electronic devices.
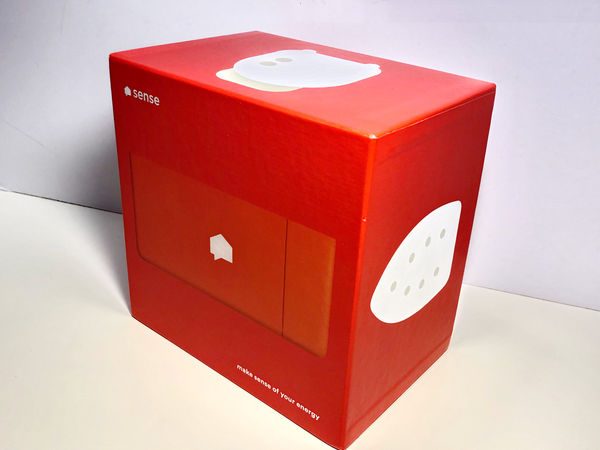
When the box cover is lifted off, a fact about each electronic device is printed on the inside box


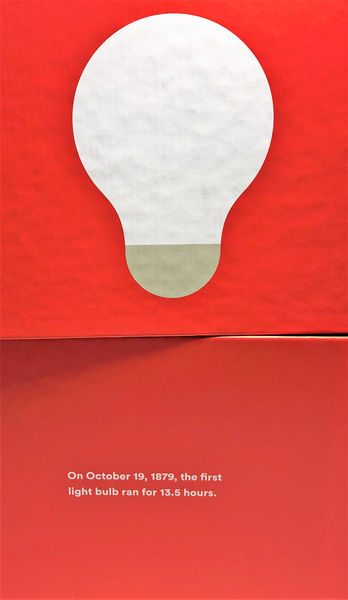

The icons (except for the one depicting the Sense unit) are used in the app to display what type of device is consuming power.
Inside the box, the Sense monitor is mounted in a cardboard frame. Below the sense monitor, the current transmitters are mounted to the outside of a folded cardboard panel which also contains the holder for external mounting, power leads, antenna, and the antenna extension cable.
Design and features
Hardware
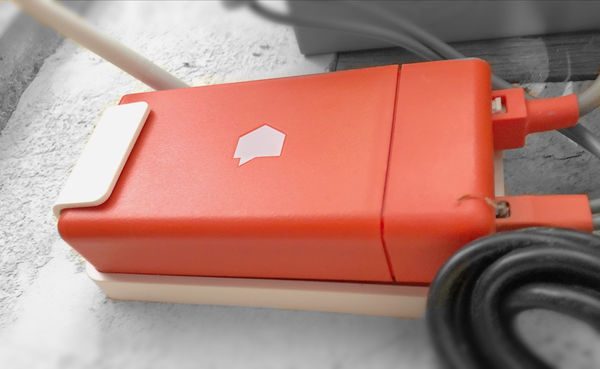
The Sense monitor is unlike most gadgets that we review on The Gadgeteer because it isn’t designed to be interacted with at all. In fact, the entire monitor can be installed inside the home’s electrical panel. What is obvious is that the manufacturer went through great lengths to make the monitor easy to install. While external mounting is always an option, the size and shape of the monitor will accommodate even the most cluttered electrical panels. The connection of the power supply and the current transmitters are made with high-quality quick connectors. The mains wires are pre-stripped and tinned. The entire installation took only 20 minutes.
For now, the Sense monitor only works on 240V single split-phase 60Hz service. This excludes most other continents besides North America and most commercial installations.
Hardware Installation
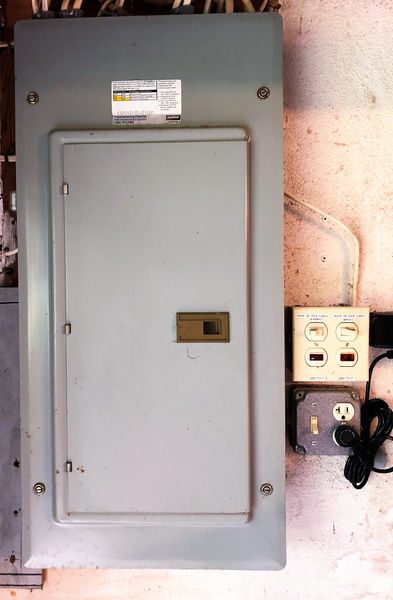
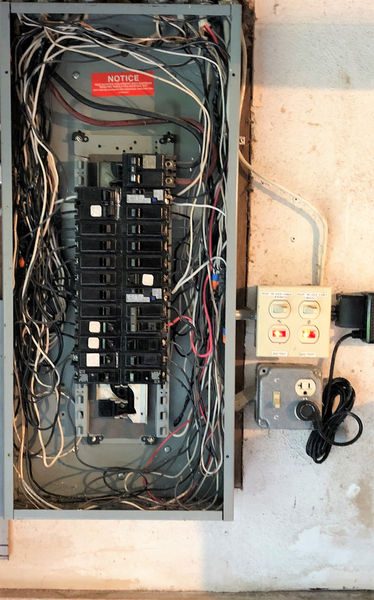
The electrical panel and the original wiring in the house are from 1971. A couple of surface mount boxes block the lower right-hand side knock-outs and the left-hand side doesn’t have lower penetrations. In addition, the panel is in the garage in the corner of the house and the Wi-Fi signal needs to travel between several floors and walls to get to the router. In light of these conditions, it was decided to mount the monitor externally and rout the cables through the bottom of the panel.
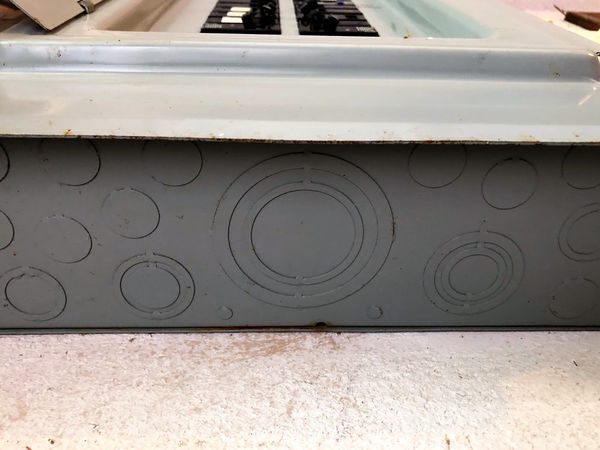
The bottom of the panel has plenty of options
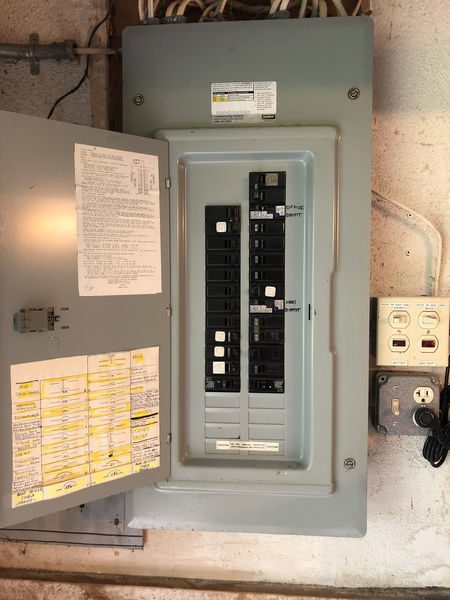
There are also plenty of blanks in the panel to add the breakers.
The inside of the panel is not the neatest, but my electrician said he’s seen worse. Most notably, there is plenty of room around the mains.
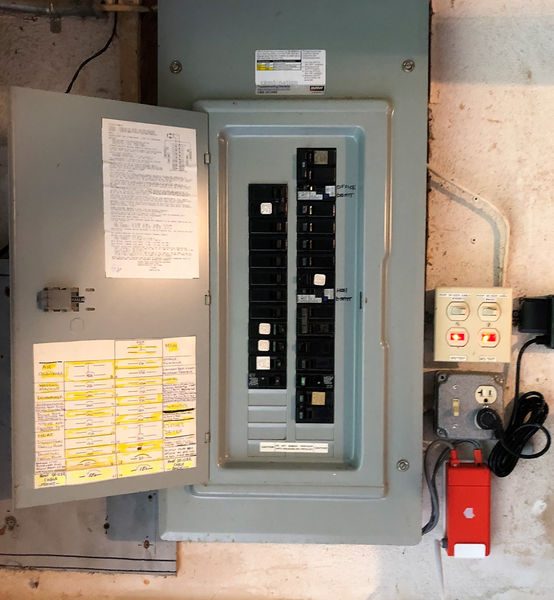
The only potential snag during an install is the correct placement of the current transmitters. They are labeled with arrows cast into the plastic housing to indicate which direction corresponds to positive current flow. The arrows are a little difficult to see. Even if one is installed backward, it’s possible that Sense automatically corrects the flow of electricity so that the electrical panel consumes power rather than generating it. After the install, the new breaker, current transmitters, and Sense Monitor are mounted. The Wi-Fi signal is tested before the panel is closed.
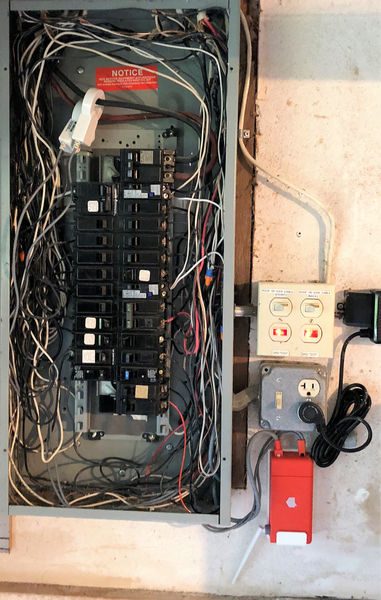
After the install is completed I have a newly installed gadget!
Note that the install above is for a unit that does not include solar power generation monitoring. The Sense monitor can also monitor the power generated by a solar power system. The solar installation would be similar except that the unit would come with two sets of current transmitters.
Software Installation
I installed version 22.2 from the iOS App Store and the Play Store. The download size is 11.27 MB for Android and 16.5 MB for iOS. The first screen has a button for you to accept the terms of service and the privacy policy. It’s important that you understand that the Sense Monitor will be transmitting all power consumption to Sense.com. It requires always-on broadband internet in the location it is installed and will use about 300 MB a day. Also, Sense indicates that they may share personal information to comply with laws or to respond to lawful requests and legal processes. After accepting the terms of service and privacy policies you are presented with the screen below
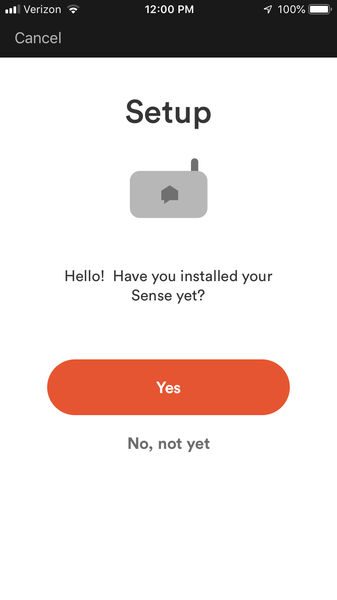
You can only create an account once the monitor is installed and powered. Furthermore, you need to be within Bluetooth transmission distances to pair the Sense monitor to the Wi-Fi signal it will be using to communicate with the internet. After you acknowledge that the sense is set up, it uses Bluetooth interrogation to find the installed monitors and set up the account. The Sense will scan Wi-Fi networks and the app will prompt you to enter the Wi-Fi credentials to connect to the network. After the Sense monitor is connected to the internet it will chime and the app will provide the ability to create an account. Only one account can be created per sense monitor, but that one account can be accessed on multiple devices simultaneously. So, if the account will be shared, then pick a password that can be shared as well.
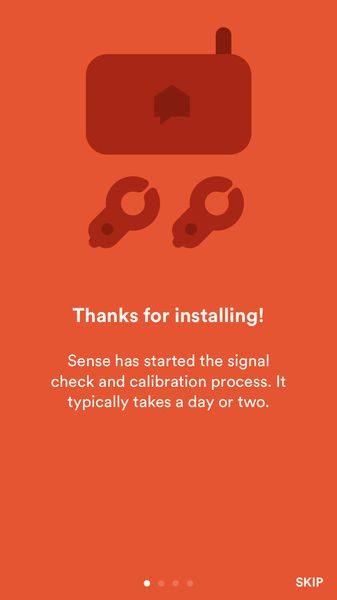
After the account is created the signal monitoring starts and the next four screens are displayed.

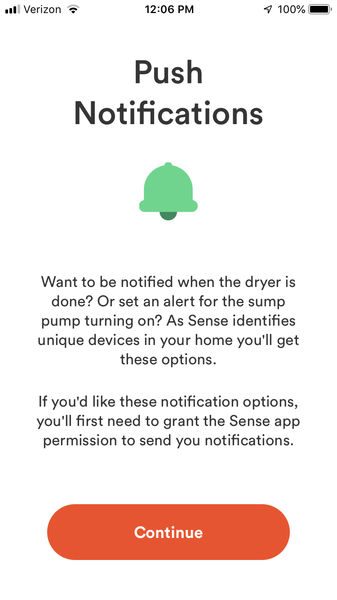
The potential of sense to identify when items are running, and to trigger events based on that detection, enables the detected appliances to trigger push notifications and events and also permits logging of that appliance’s use. The two examples, of knowing when the dryer is stopped or when the sump is running are two key items that I’m waiting to enable on my installation. (I’ll be able to do this once Sense identifies those items.)
Software Design
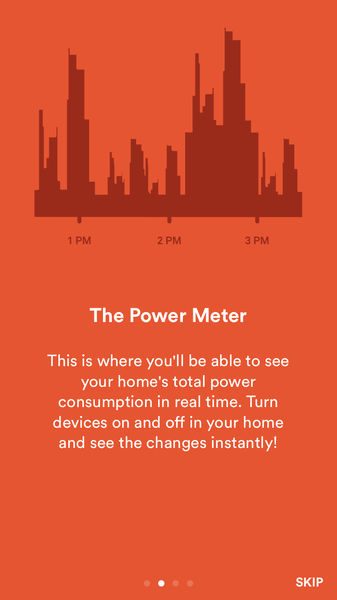
After reading the above screen the power timeline is displayed. The power timeline shows the real-time and historical power usage.
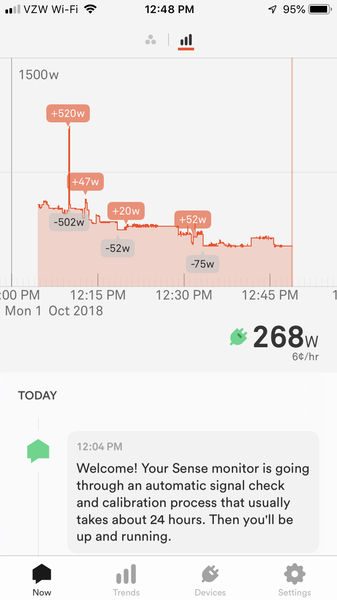
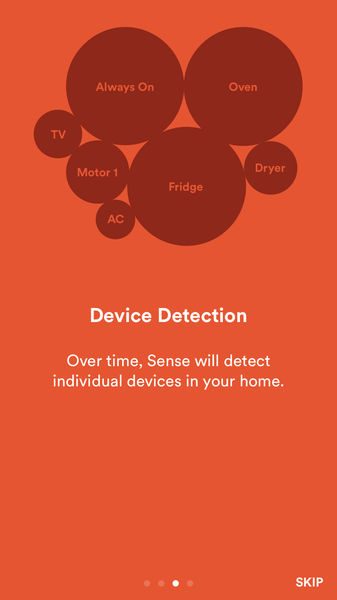
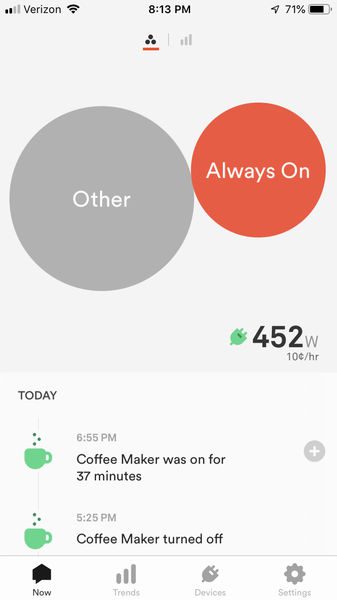
Large changes in usage are identified by the change in power drawn in Watts; positive changes are in orange and negative changes are in grey. The timescale can be pinch-zoomed to show 90 seconds across the screen or three years worth of data. The vertical axis (Watts) can also be pinched zoom to identify large contributors to the power draw or minuscule changes. (The vertical timescale cannot be panned – it always crosses at 0 Watts.) Clicking the circle icon at the top creates a free-floating bubble chart. The circle size is proportional to the percentage of energy used at the time. Like the power timeline, this display can be pinch-zoomed as well.
If the device is in landscape mode the display rotates accordingly. In either case, the total usage is shown in the lower right-hand side of the screen. Clicking on the power usage brings up the usage screen, but the usage screen can also be navigated to from the trends screen.
The trends screen shows goals, usage and power meter.
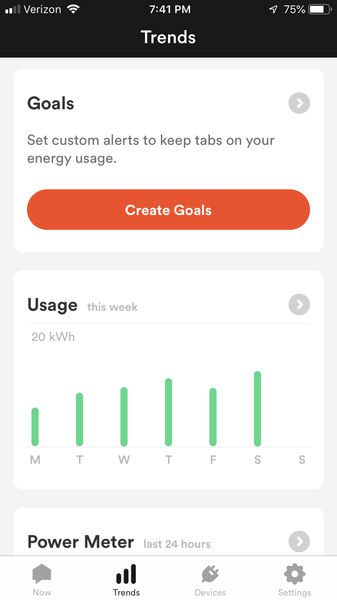
Goals
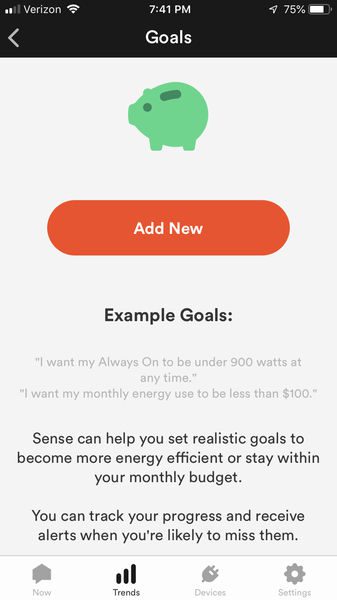
Goals allow a user to define the total measured usage, or the measured usage that is always on, to be under a specified dollar amount or energy at any point, or at the end of a day, week, month or cycle. Many goals can be set at the same time too. This is a truly flexible system that will allow you to keep an eye on meeting electrical energy consumption goals.
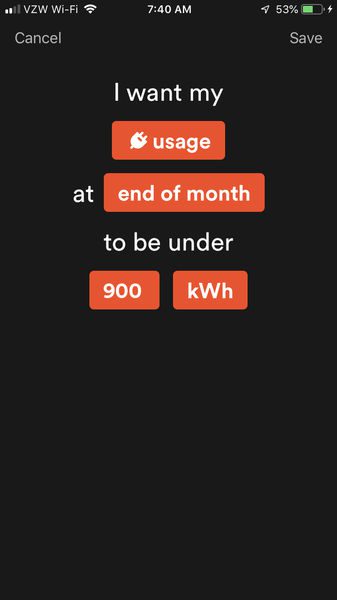
The text of the goal is changed by clicking on the orange boxes. When it comes time to assign a time period to the goal the app displays recent historical values in the space below the text. This helps in ensuring the goal is reasonable. All in all, I wish more apps offered this type of S.M.A.R.T (specific, measurable, achievable, results-focused, and time-bound) goal setting.
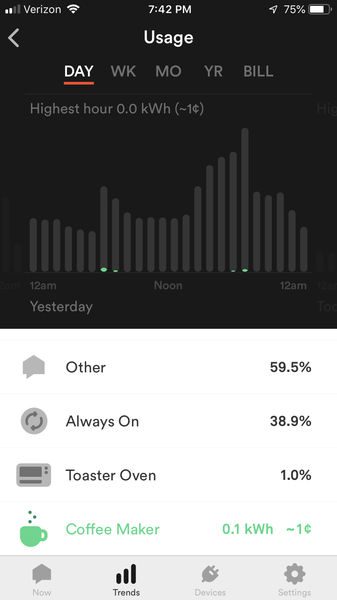
Usage
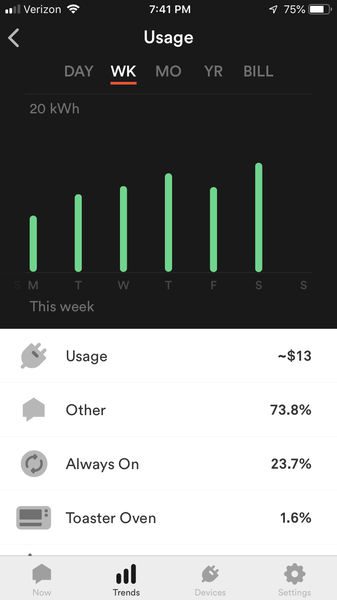
Usage shows a bar chart of the day, week, month, year or bill period. The devices contributing to the users are shown below the bar chart. The percent that each device contributes to the usage in the period is displayed next to the device. A click on the device will highlight only that device’s contribution to the usage on the chart, and show the energy that the device used and the dollar amount that the energy consumed cost.
Power Meter
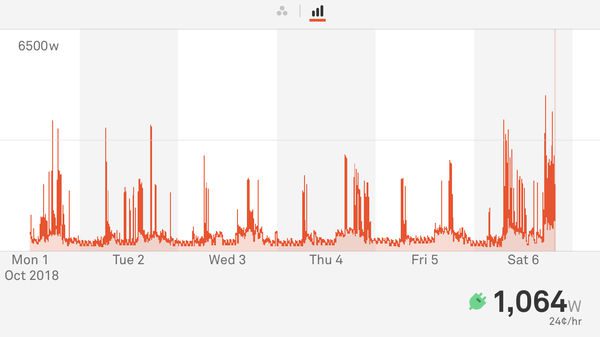
The power meter shows the last 24 hours in the trends screen and clicking on it brings up a screen similar to the Now screen
The Devices screen shows each device and the current power the device is consuming.
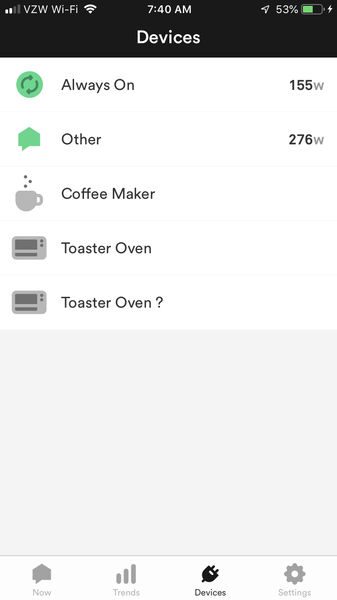
Over time this screen will be populated with more and more devices. This early on in the Sense usage I only have the three other devices besides the “Always On” device. A click on the device will show stats for the device, usage for the particular device, and a power meter for the last 24 hours for that device. This screen is helpful to verify that the device that Sense thinks is on is actually the device being used in the house.
The settings screen permits changes to the account
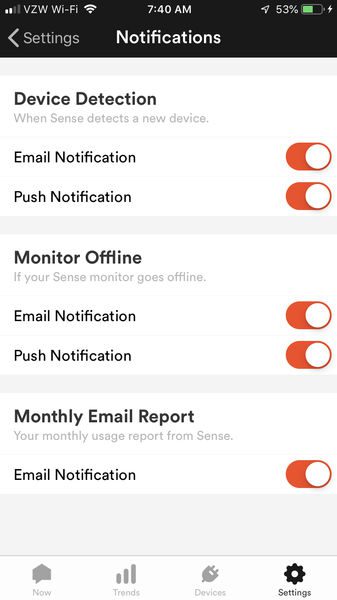
virtually the only difference between the iOS and Android versions is a general submenu on the iOS version which permits sound to be enabled or disabled. The Android version does not have this feature.
Operation
This will be part 1 of the operation review. It will take a couple of months to get a full understanding of the potential of Sense. Why? Well, based on the typical usage of appliances and the way that machine learning takes place, it is nearly impossible to speed up the assignments of devices to the electrical signals they generate. Normally I don’t like nuisance notifications, but I think that I’d have more peace of mind if periodically the app reminded me that it’s still matching devices to the power draw.
The only function immediately available is the power timeline. That alone is a very valuable tool. It shows what the main power draws are and what the minimum power draw is per day. The minimum power draw can indicate if there are power ‘vampires’ drawing power without providing any benefit. Just having the Sense installed makes me more cognizant of the energy usage in my house. Similar to the phenomenon people experience wearing a step-counter, if there is a measure that one has control over, control is likely to be better managed.
I installed my Sense on a Monday afternoon. By that evening the signal check was complete and Sense started to listen to the home and identifying devices. By late Tuesday evening, it identified my Coffee Maker. Actually, it only identified the maintenance heating of my Keurig. Over time it may identify the main heating and the pump. Wednesday, It determined that my minimum power usage, or always on value, is 156 Watts, or 13.7 kWh. From Sense’s statistics, it has determined that the average always on value is 288 Watts. Thursday morning, Sense determined that my average daily power usage is 9.2 kWh. Friday at 1:30 AM it found a new device and named it Heat 1. I wasn’t sure if this was a toaster or another part of my coffee maker. Saturday afternoon if found a new device and named it Heat 2. It seems that from the power meter I was able to determine this is a toaster oven. This is a Breville toaster, so the heating element cycles frequently. My app was alerting me that the toaster was turning on and then turning off 17 seconds later about every minute. I turned the alerts off for this appliance.
What I like
- Easy Installation
- Beautiful UI
What needs to be improved
- More indication that patterns are being matched
- Would be great if you could “force” a detection
Final thoughts
The Sense Home Energy Monitor delivers on providing instantaneous and historical energy usage and promises enhanced device detection. After living with Sense for an extended time I will provide a thorough review of how it has impacted my life.
Price: $299, $349 for the solar version
Where to buy: Amazon
Source: The sample for this review was provided by Sense.
Filed in categories: Reviews
Tagged: Home and Kitchen, Power
Sense home energy monitoring device review (part 1) originally appeared on The Gadgeteer on October 12, 2018 at 9:00 am.
Note: If you are subscribed to this feed through FeedBurner, please switch to our native feed URL http://the-gadgeteer.com/feed/ in order to ensure continuous delivery.